Article
9 Feb 2026
Case Study: AUDJPY Breakout
This case study examines a breakout-based MT4 Expert Advisor tested on AUDJPY using a $10,000 baseline account. The strategy is designed to trade volatility expansions during key session opens, with strict risk constraints and defined drawdown limits.

Strategy Overview
The EA is built around session breakout logic. It waits for price to break beyond a defined lookback range during major liquidity transitions, specifically:
Asia session open
London session open
Fixed lookback period defining breakout levels
Risk-defined position sizing per trade
The objective is to capture directional momentum immediately following volatility expansion rather than mean reversion.
Backtest Configuration
Instrument: AUDJPY
Timeframe: M5
Data range: 1 January 2021 – 16 May 2025
Account size: $10,000
Risk per trade: ~$1,000 (10%)
Execution model: breakout continuation
Session triggers: Asia open and London open (UTC+2 broker time)
Hypothesis
AUDJPY exhibits a systematic tendency to make a directional breakout within the first 90 minutes of the Sydney session open, driven by the confluence of returning Asian liquidity, Australian institutional order flow, and the AUD/JPY cross's sensitivity to risk sentiment shifts that accumulate during the overnight New York close. The strategy exploits this recurring volatility expansion window by entering on breakout confirmation and exiting at a defined target or stop.
Performance Summary
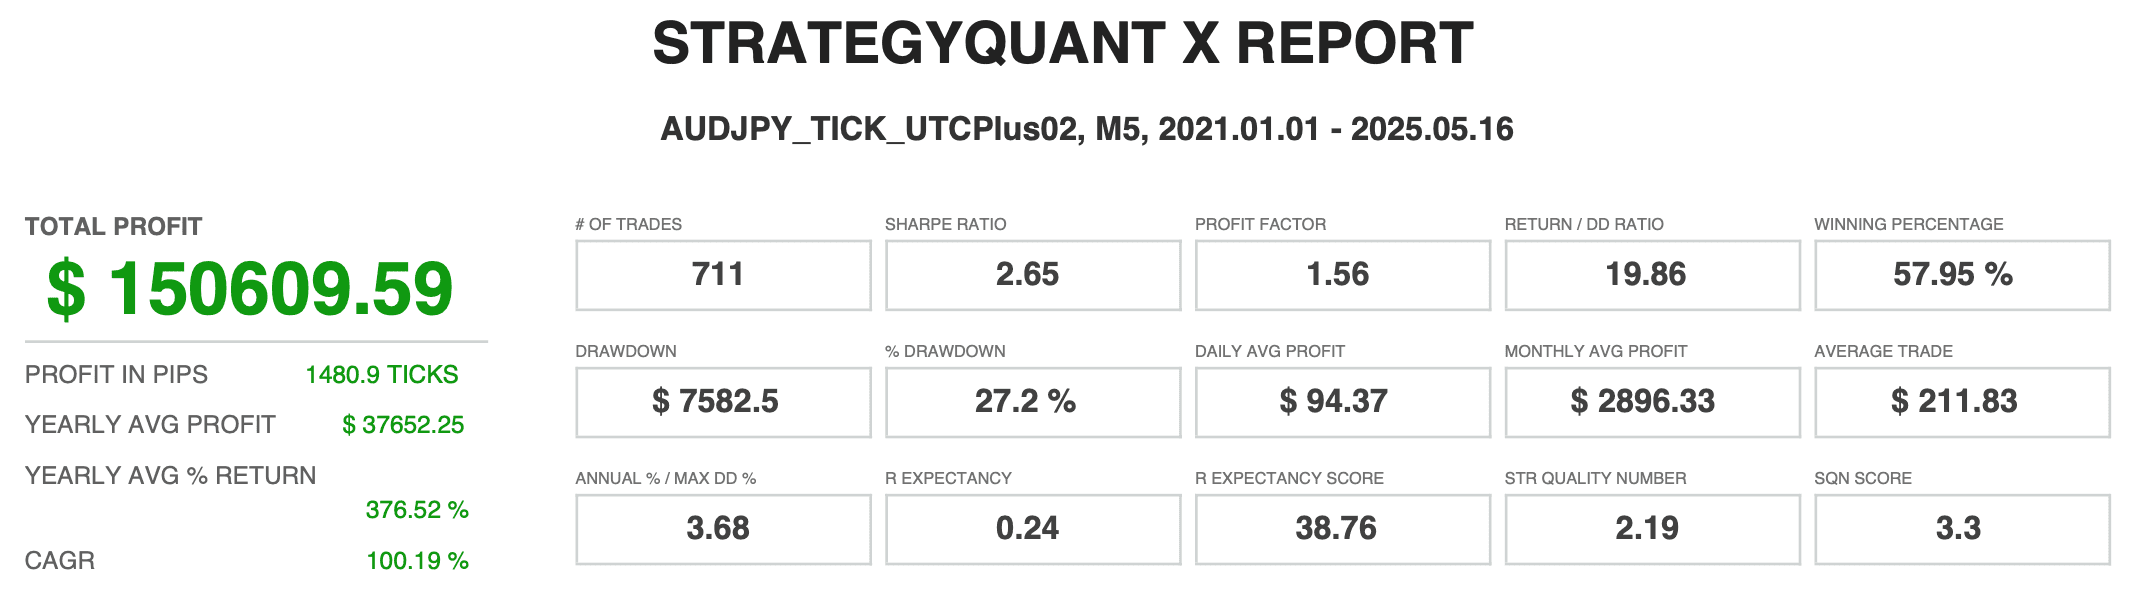
The backtest generated strong risk-adjusted returns over the testing period.
Total trades: 711
Win rate: 57.95%
Gross profit: $418,659
Gross loss: $268,049
Net profit: $150,609
Sharpe ratio: 2.65
Profit factor: 1.56
Max drawdown: $7,582
Return / drawdown ratio: 19.86
Average trade: $211.83
CAGR: ~100%
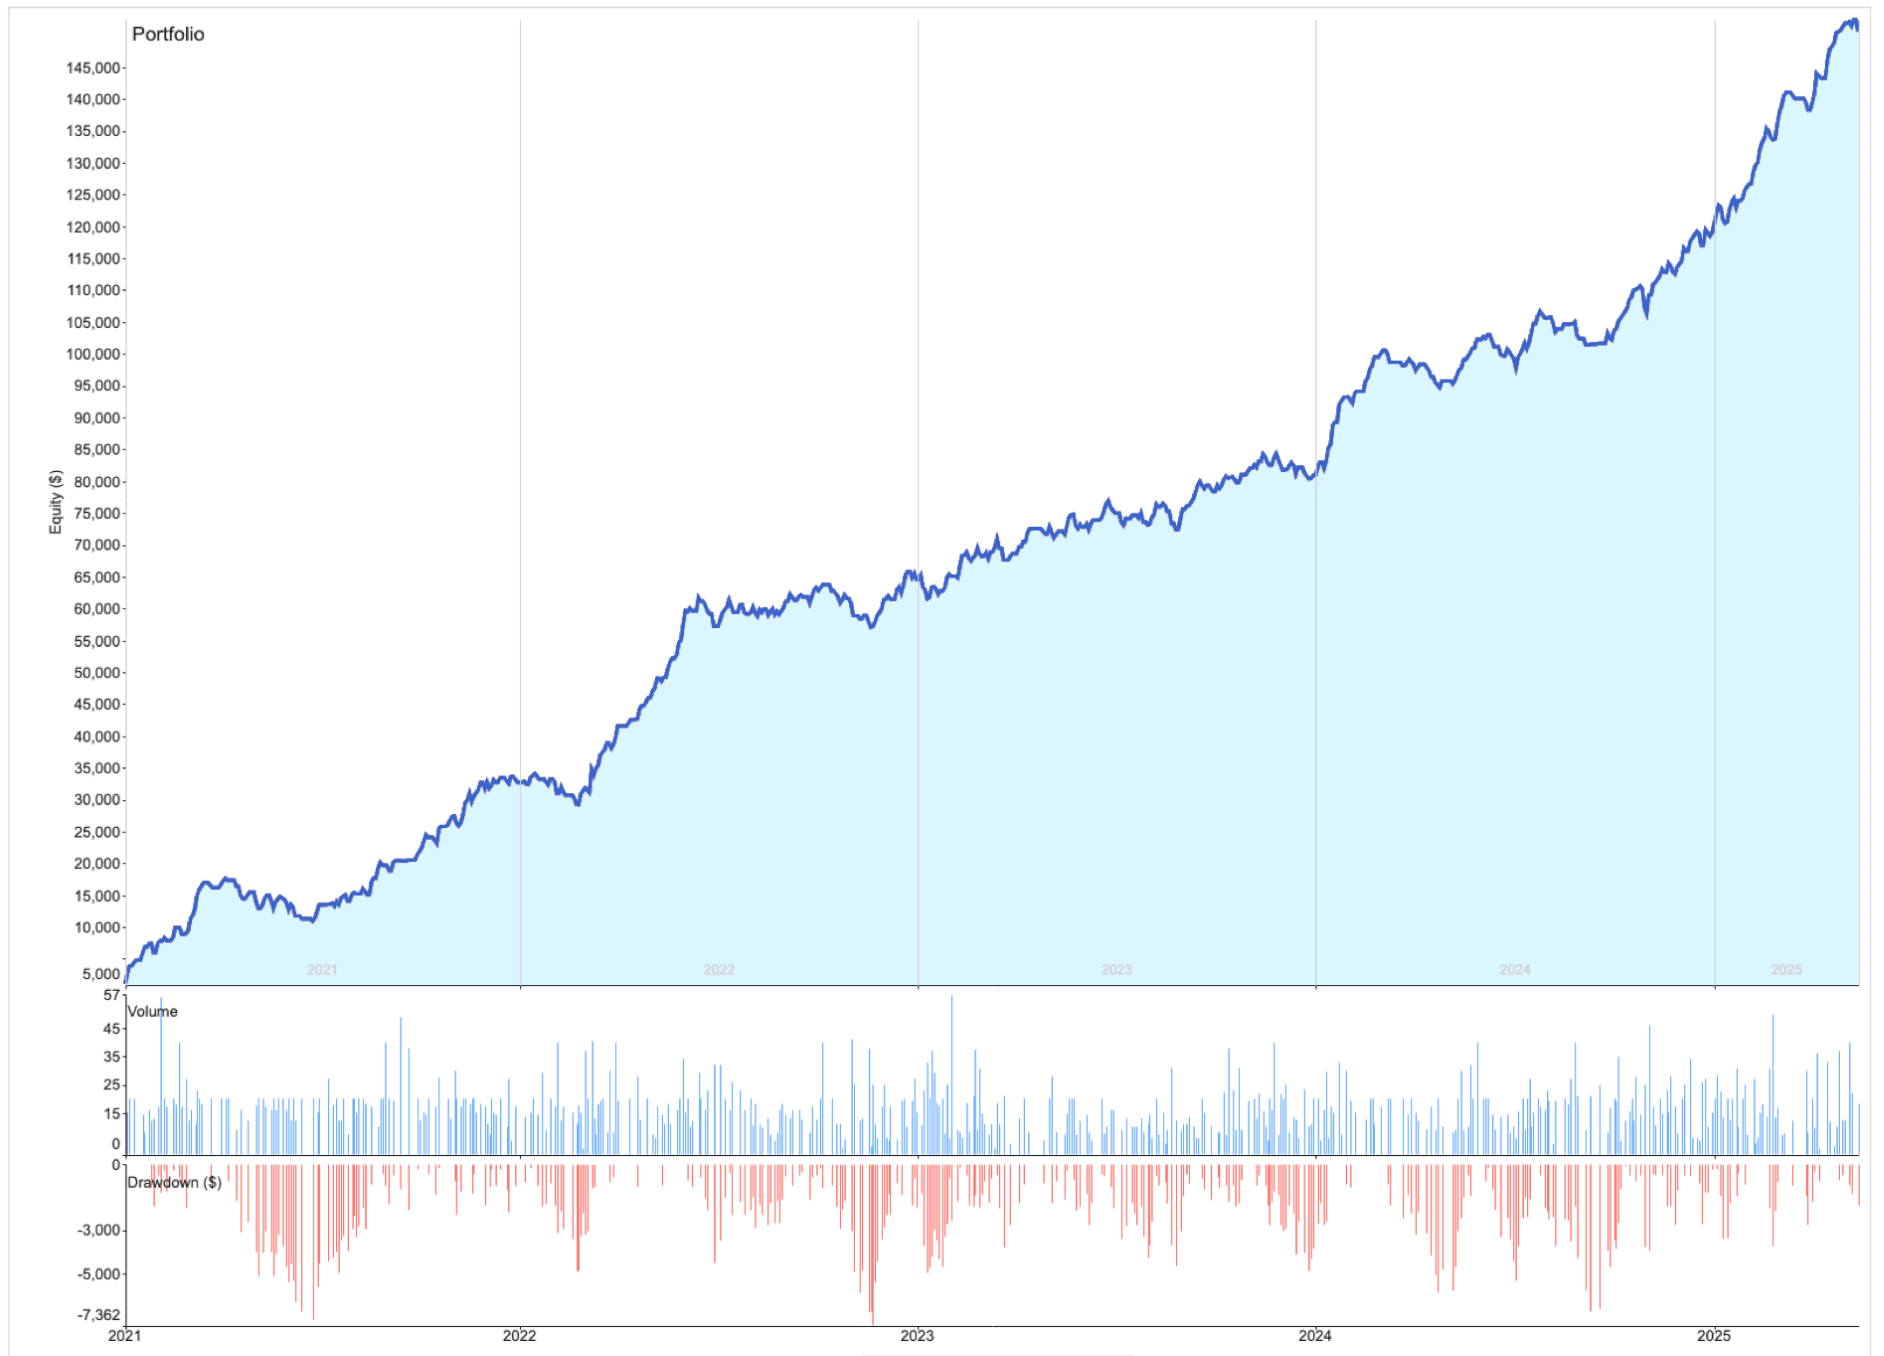
The equity curve shows consistent upward progression with manageable stagnation periods (~140 days).
Risk Structure
The system was intentionally configured to risk approximately $1,000 per trade on a $10,000 account, equivalent to 10% exposure. This creates an intentionally aggressive testing scenario designed to stress-test drawdown behaviour.
Under this configuration:
Maximum drawdown remained below $8,000
Drawdown stayed within ~27% peak-to-valley range
Winning percentage remained close to 58%
This suggests the underlying logic is resilient even under elevated risk conditions.
Prop Firm Scenario Example
If applied to a $100,000 prop firm account, the same logic can be scaled conservatively:
Maintain absolute risk at $1,000 per trade
This becomes 1% risk instead of 10%
Effective drawdown ceiling remains ~$10,000
Keeps trading within a typical 10% max drawdown rule
This demonstrates that the strategy architecture can be adapted to stricter risk environments without altering core logic.
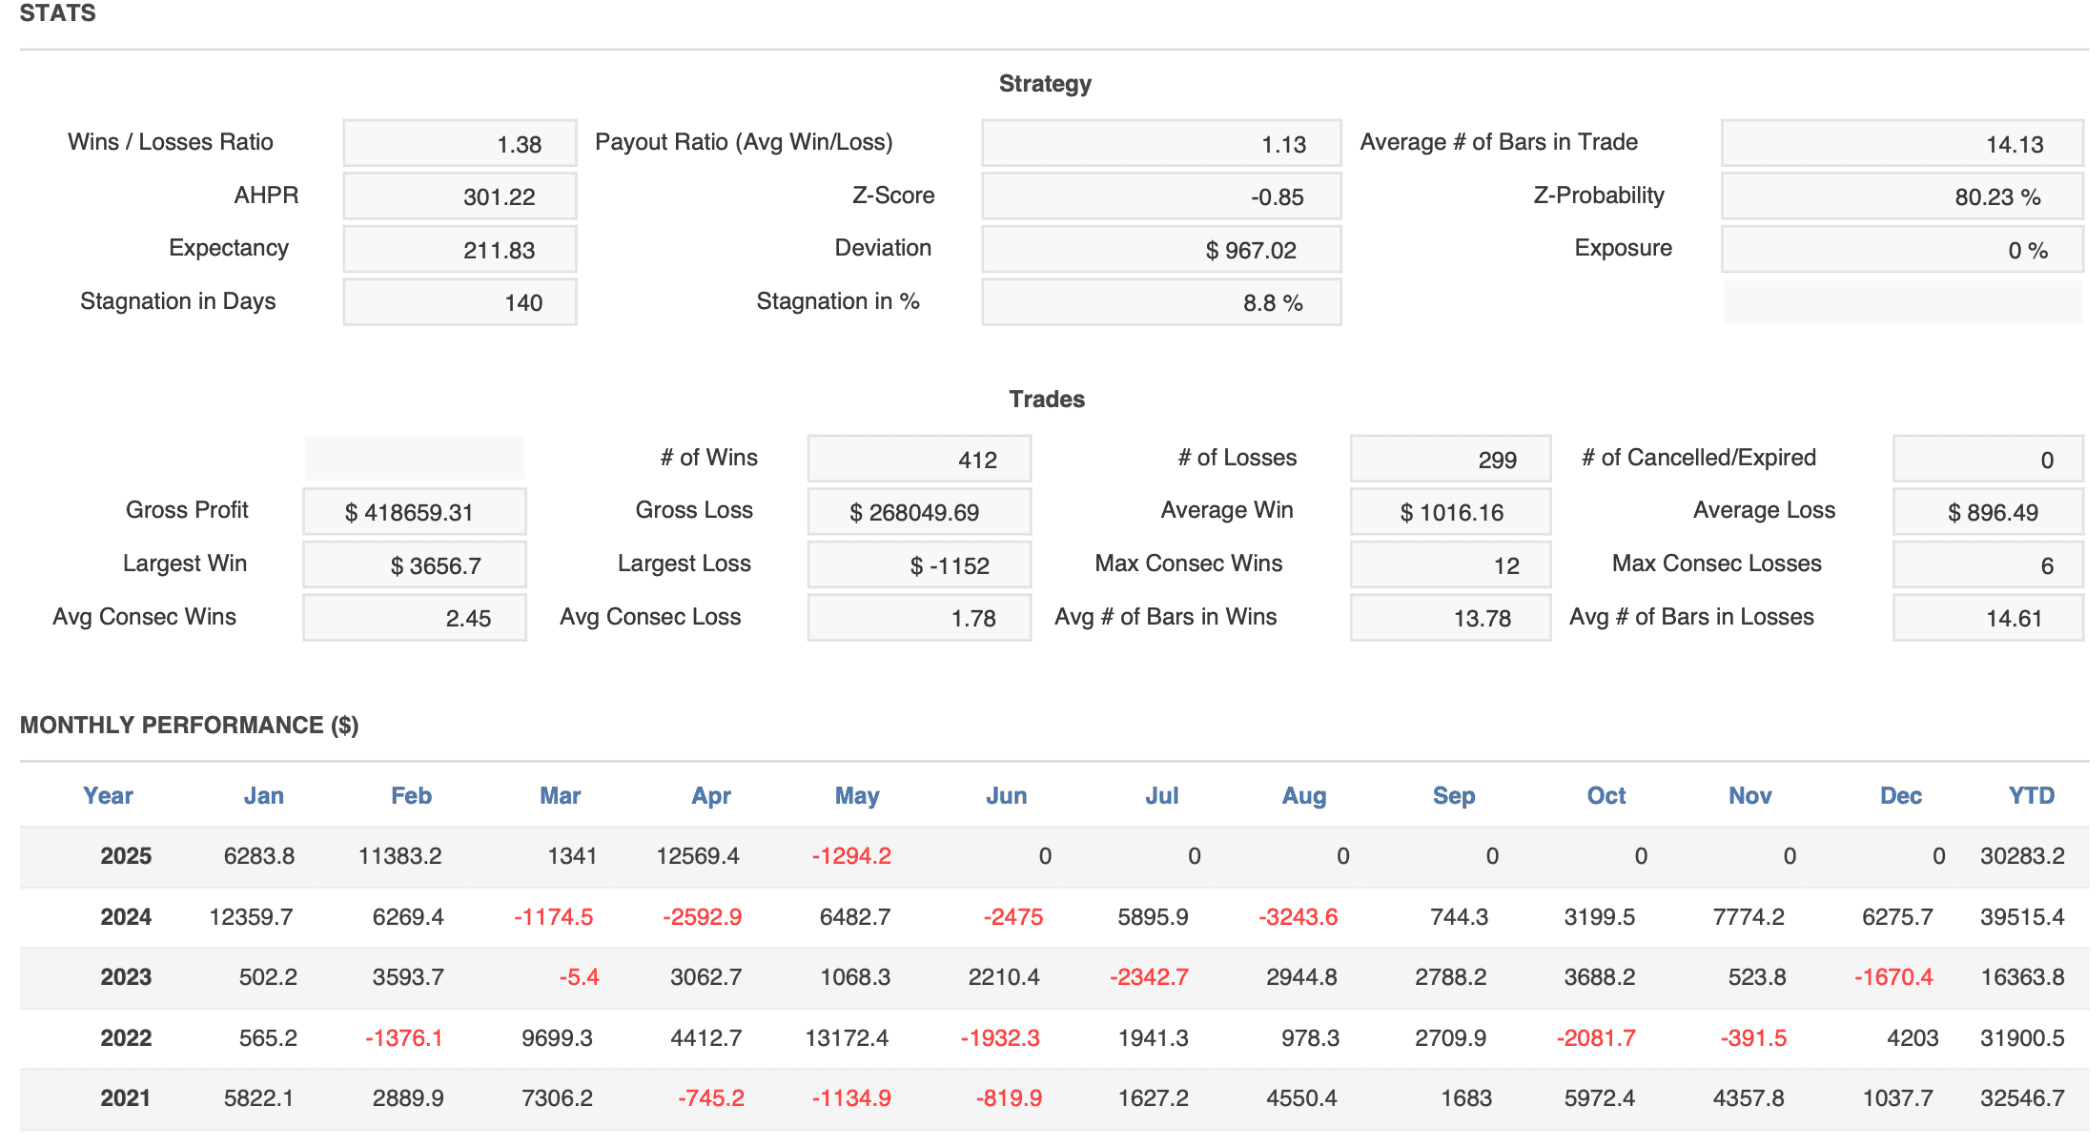
Trade Behaviour Characteristics
The strategy exhibits:
Strong but realistic win rate (~58%)
Slightly larger average wins than losses
Limited consecutive losses (max observed: 6)
Short trade durations (average ~14 bars)
These properties are consistent with breakout continuation systems that rely on momentum bursts rather than long trend holding.
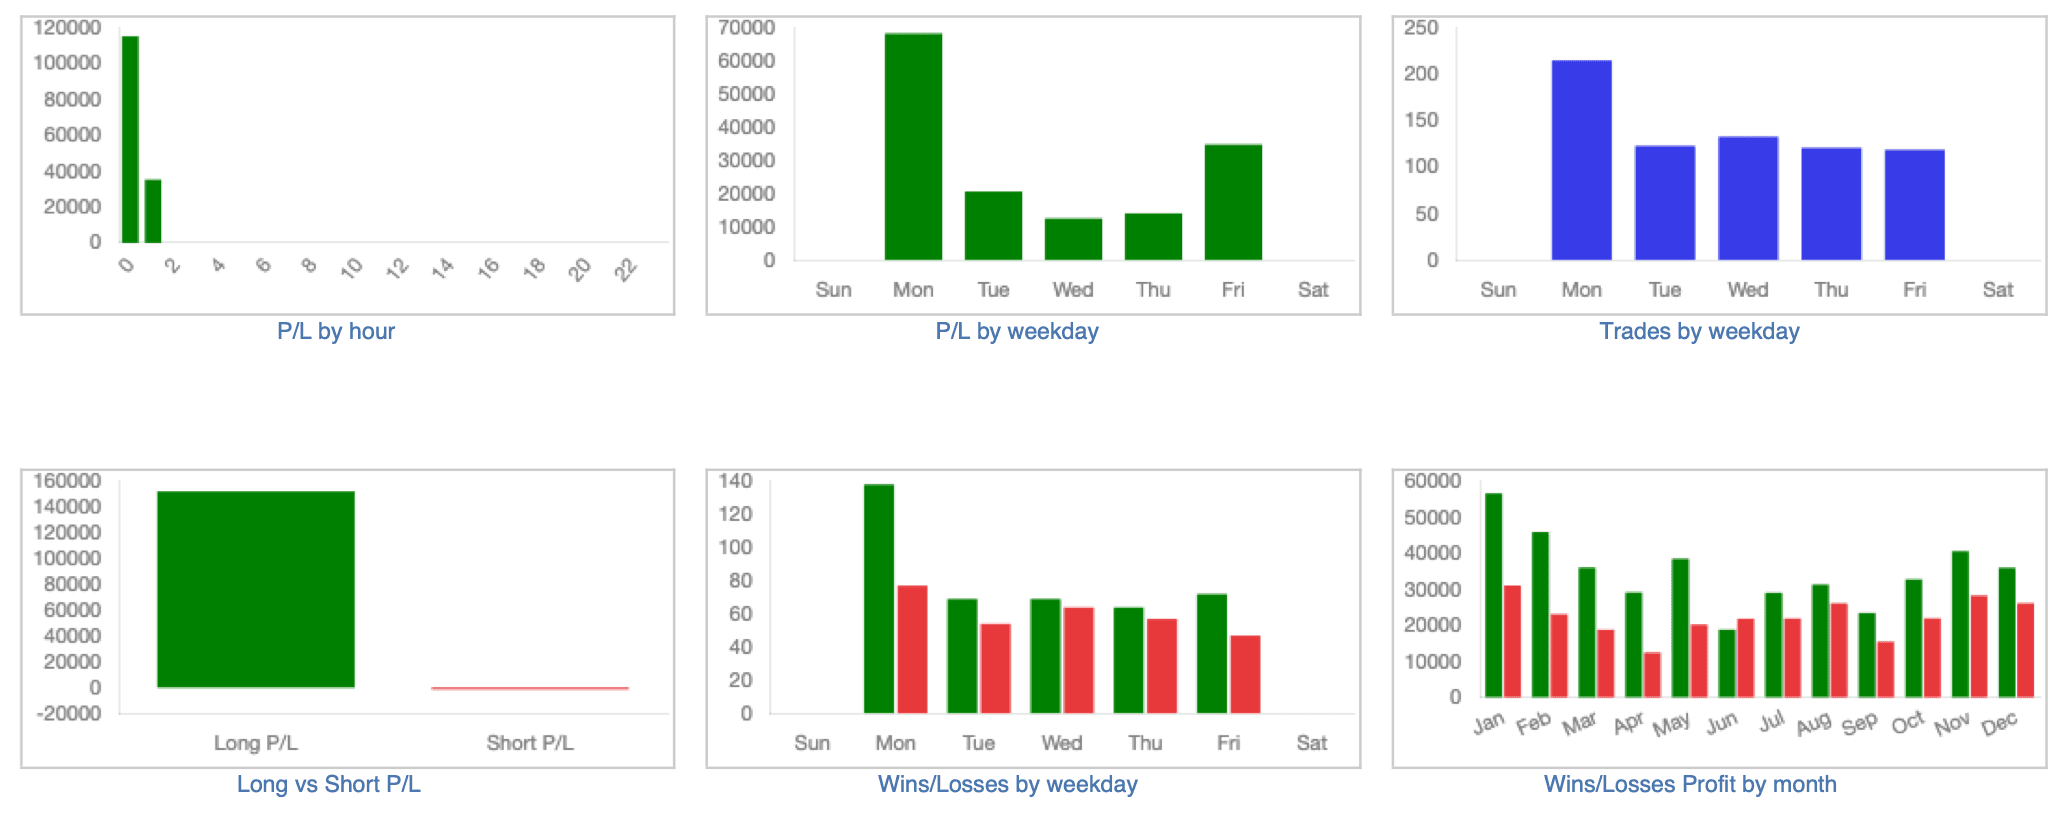
Session-Based Edge
Preliminary breakdowns indicate stronger performance during high-volatility session transitions. In particular:
London open breakouts produced consistent directional follow-through
Asia session volatility expansion also contributed materially
Monday behaviour shows potential for optimisation
Further refinement could include:
Restricting trading to specific weekdays
Adjusting lookback windows per session
Volatility filters prior to entry
These are optimisation paths rather than structural requirements.
Strategy Logic Summary
Identify consolidation range using defined lookback
Wait for breakout during Asia or London session open
Enter in breakout direction
Apply fixed risk-based position sizing
Exit via predefined TP/SL logic
The design emphasises simplicity, repeatability, and controlled exposure.
Key Takeaways
The EA demonstrates stable performance across multiple years
Drawdown remains contained relative to return
Risk can be scaled linearly across account sizes
Session-based volatility is the primary driver
Additional optimisation opportunities exist
Notes on Interpretation
This is a historical backtest using broker-time UTC+2 data. Results may vary depending on:
Broker execution
Spread differences
Slippage
Liquidity conditions
The purpose of this case study is to illustrate behaviour and risk characteristics rather than guarantee performance.